Your Disk-Full Alert Is Lying: Stop Alerting on Percentages
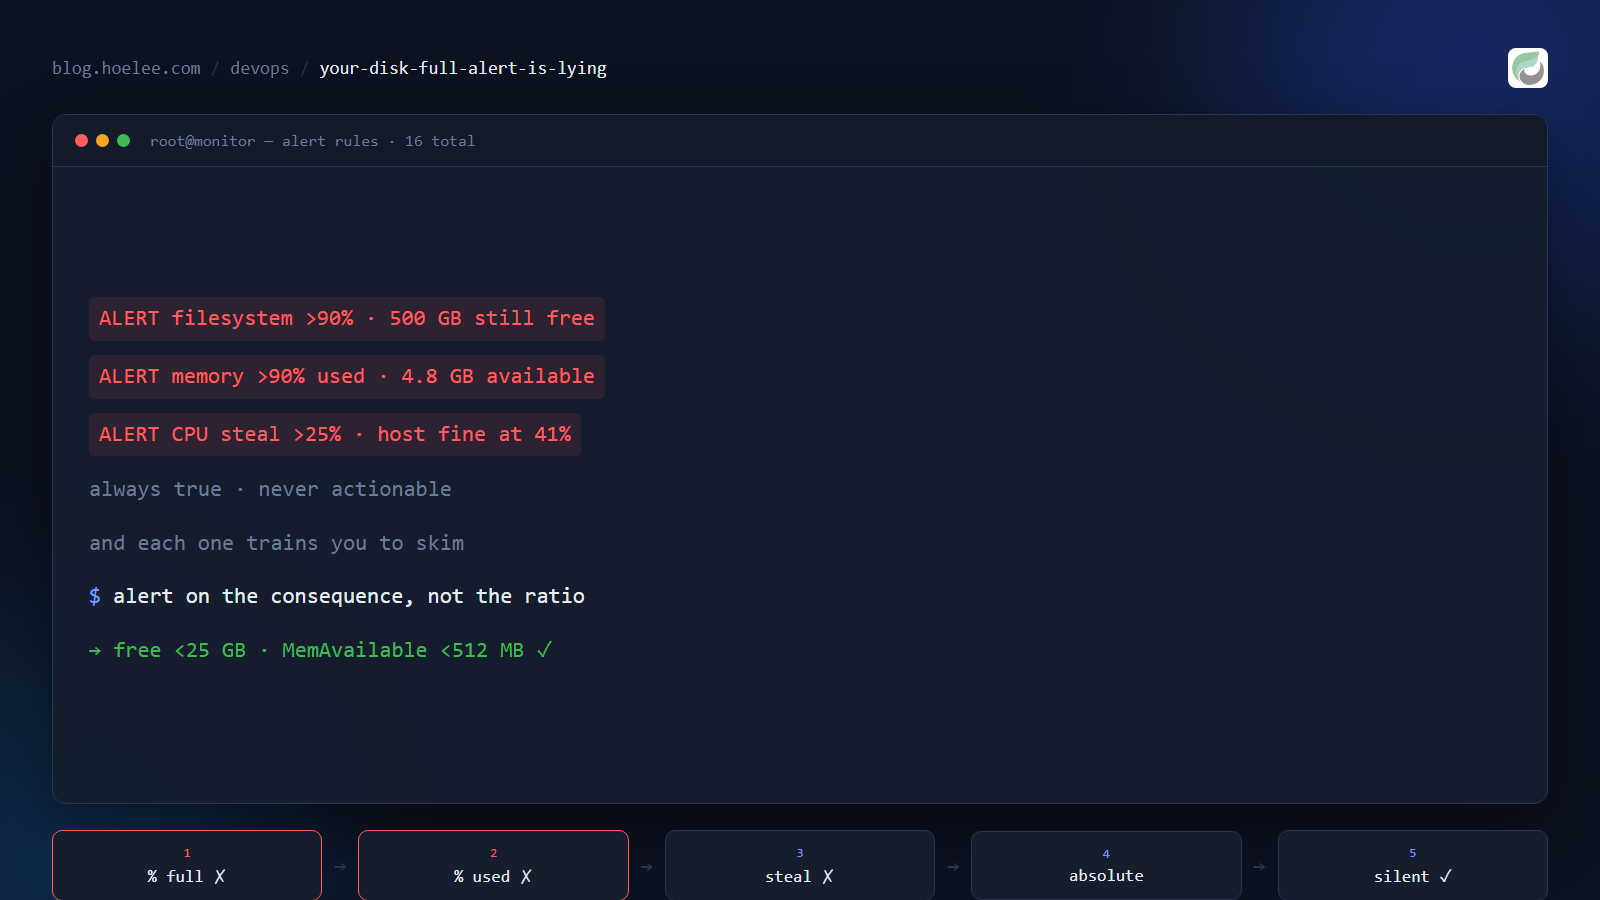
I built a monitoring stack, wrote a reasonable set of rules, and then spent an afternoon deleting most of my own thresholds. Every one of them was a percentage, and every one of them was wrong in the same specific way.
The three alerts that taught me
1. “Filesystem above 90% used.” It fired on a 17 TB volume that had ~500 GB free. Nothing was wrong. Nothing was about to be wrong. On a volume that size, a single large backup can swing the percentage by several points — the ratio is noise, and the fact that 500 GB is still available is the actual state of the world.
2. “Memory above 90% used.” Fired constantly on a host with 4.8 GB available.
Linux uses free RAM for page cache and gives it back on demand; MemTotal - MemFree
describes your filesystem cache, not your risk. The number that predicts an OOM is
MemAvailable.
3. “CPU steal above 25%.” Fired on a VPS that had been running its mail stack perfectly at 41% steal. Steal means the hypervisor is busy — it is a capacity signal, not a failure signal, and 41% steal on a 7-vCPU box was simply what that host costs. The rule produced alerts that were always true and never actionable.
The common thread: I was alerting on a ratio, and the ratio doesn’t know how big the thing is.
Alert on the consequence, not the ratio
The test I now apply to every threshold: if this condition persists, what will actually happen? That answer is almost always expressible in absolute units.
| Instead of | Alert on | Because |
|---|---|---|
| Filesystem > 90% | Free space < N GB | “Can I still write?” is the question |
| Memory > 90% used | MemAvailable < 512 MB | about to OOM, not “cache is warm” |
| CPU steal > 25% | Steal > 50% | capacity cost vs. starvation |
| Load average > N | load1 / cores > 2 | load is meaningless without core count |
In PromQL, before and after:
# BEFORE — percentage of a 17 TB pool; fires with half a terabyte still free
(1 - node_filesystem_avail_bytes / node_filesystem_size_bytes) * 100 > 90

# AFTER — capacity left, on the volumes that hold data
min by (instance, mountpoint) (
  node_filesystem_avail_bytes{mountpoint=~"/volume[0-9]+|/mnt/ssd|/mnt/disk[0-9]+"}
) < 25e9
# BEFORE — page cache counted as "pressure"
(1 - node_memory_MemAvailable_bytes / node_memory_MemTotal_bytes) * 100 > 90
# AFTER — the actual OOM precursor
node_memory_MemAvailable_bytes < 512 * 1024 * 1024Two details that make these rules survive contact with a real dashboard:
Keep the comparison in the threshold condition, not inside the expression. Query
min by (mountpoint) (node_filesystem_avail_bytes{...}), then let the alert rule
compare it to 25000000000. If you bake < 25e9 into the PromQL and leave an
inherited > 90 in the rule, the rule still evaluates — but it displays a nonsense
threshold, and the next person to read it has to reconstruct your intent from two
contradictory conditions.
Exclude the mounts that are views of other mounts. A “free space” rule is only as
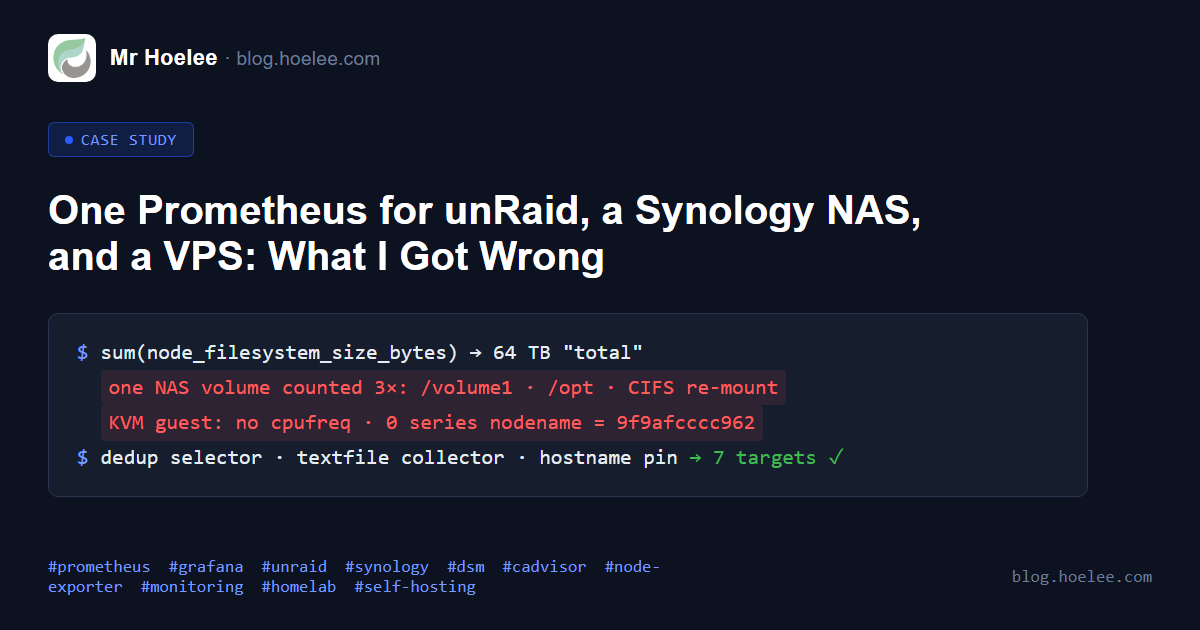
honest as its selector. On my own setup, one NAS volume appears three times (as
/volume1, as /opt, and again on another host as a CIFS re-mount), and unRaid’s shfs
union mount reports avail=0 — a rule without exclusions would either fire forever or
double-count capacity. One explicit selector beats a clever generic one:
node_filesystem_avail_bytes{mountpoint=~"/volume[0-9]+|/mnt/ssd|/mnt/disk[0-9]+"}Noise is not harmless
The cost of a bad threshold isn’t the alert itself — it’s the training. Every alert that fires while nothing is wrong teaches you to skim, then to ignore, and then the one that matters arrives in a channel you’ve stopped reading. My rule count went down while coverage went up: fewer, each tied to a named consequence.
Thresholds are personal, shapes are not
The specific numbers above are mine — 25 GB free before a NAS volume bothers me, 512 MB available before I care about memory, 50% steal before a VPS is being starved. Yours will differ with your hardware and your tolerance.
What transfers is the shape:
- absolute units over ratios,
- the consequence written into the alert’s summary,
- a selector that states exactly which mounts it speaks for,
- and a rule count small enough that you still read every message.
The result
The same stack that was producing three permanent, uninformative warnings now runs 16 rules that stay silent when the lab is healthy — and one of them immediately surfaced a NAS volume sitting at 21 GB free, which is the kind of thing a percentage rule had been hiding behind a 99%-full giant that I’d learned to ignore.
Want this for your business?
If your monitoring sends you alerts you’ve learned to ignore, or you have none and would rather find out about a full disk from a rule than from a failed backup, I set up self-hosted monitoring and alerting (Prometheus + Grafana, alerts to Telegram and email) with thresholds tied to what actually breaks.
WhatsApp: +60 12-797 2969 · Email: [email protected] · hoelee.com
Website design and development is my main line of work; server hardening and self-hosted infrastructure is the other half of it.