One Prometheus for unRaid, a Synology NAS, and a VPS: What I Got Wrong
Why this matters
A homelab is not a toy when it’s running other people’s websites, mail and files. The difference between a bad week and a bad month is usually how early you found out: a disk with a reallocated sector, a volume with 20 GB left, a VM being starved of CPU by its host, a container that restarted four times overnight while you slept.
I had three machines — unRaid (the daily driver), a Synology NAS (the storage and services box) and a VPS (the public-facing one) — and three separate ways of not knowing what they were doing. This is how they became one screen, and the four things I got wrong on the way, because three of them are traps you will hit too.
The architecture
One Prometheus and one Grafana, running on the host that never sleeps. Every monitored host runs two exporters:
| Machine | Host metrics | Container metrics | Scrape path |
|---|---|---|---|
| unRaid | node_exporter (:9100) | cAdvisor (:8080) | direct |
| Synology DSM | node_exporter (:9100) | cAdvisor (:8082) | LAN |
| ServerHosh VPS | node_exporter (:9100) | cAdvisor (:8081) | VPN tunnel + nginx stream relay |
node_exporter and cAdvisor are not substitutes — this is the first thing people get wrong. node_exporter sees the host: CPU, memory, network, disks, filesystems, temperatures. It is cgroup-blind: it cannot tell you which container is eating your RAM. cAdvisor sees containers only. If you want both host health and per-container accounting, you run both. Dropping either one leaves a hole that shows up months later as an unexplained load spike.
Wrong #1: cAdvisor’s “containers” that aren’t containers
My container rules started firing on things that were not containers. cAdvisor exports cgroup series for systemd slices and for the machine-wide cgroup — including one unnamed series that reported roughly 58 GB of “memory usage” with no container attached to it. That is the whole host, described as a container.
The fix is one filter, but you have to know to write it:
# container metrics: anything with a name, and only that
container_memory_working_set_bytes{job=~"cadvisor.*", name!=""}
Without name!="", a “container using more than 10 GB” rule alerts on the host itself.
Wrong #2: my “total storage” number was fiction
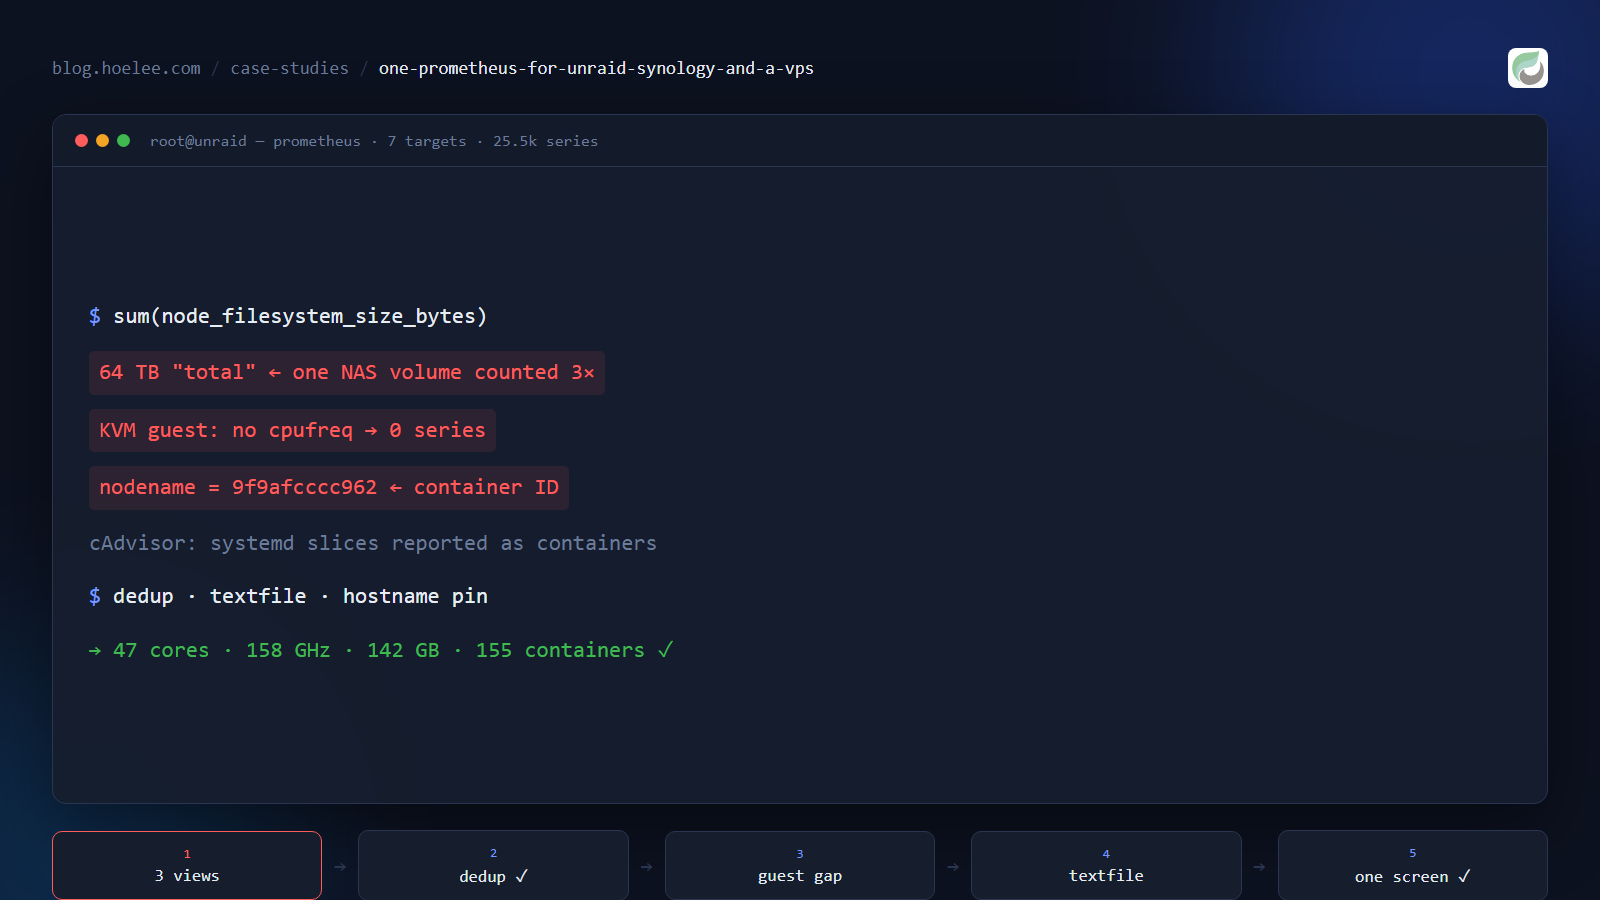
The aggregate panel looked great and was simply wrong. The reason: one filesystem appears in the metrics more than once.
- On the NAS, the primary volume is
/volume1— and/optis the same btrfs filesystem, exposed under a second mount point. - On unRaid, that same NAS volume is mounted again over CIFS as
/mnt/remotes/<nas>_ActiveBackup. - unRaid’s
/var/lib/dockeris a subvolume of the pool that/mnt/ssdalready represents — same bytes, second identity.
A naive sum(node_filesystem_size_bytes) therefore reported capacity for disks I don’t
have. The honest selector names exactly what counts as data storage:
node_filesystem_size_bytes{
  mountpoint=~"/volume[0-9]+|/mnt/ssd|/mnt/disk[0-9]+",
  fstype!~"fuse.*|tmpfs|rootfs"
} or node_filesystem_size_bytes{job="vps-host", mountpoint="/"}
Two more honesty notes that belong in the panel description, because a number nobody can interpret is worse than no number:
- Parity disks are invisible to the kernel. unRaid’s parity drive has no filesystem, so it never appears — the sum is usable capacity, not raw spindle count.
- A mirror inflates a raw sum. Two mirrored SSDs report their bytes twice; the sum is not what you can store.
And the omission that would have bitten me later: unRaid’s shfs union mount (/mnt/user)
reports avail=0. Including it in a “free space below X” rule produces an alert that
can never be resolved.
Wrong #3: the VM that exports no CPU frequency
Wanting “total CPU frequency” across the lab, I reached for node_exporter’s cpufreq
collector. unRaid and the NAS reported node_cpu_scaling_frequency_hertz per core. The
VPS reported nothing at all — it’s a KVM guest, and a guest has no
/sys/devices/system/cpu/cpu0/cpufreq. The metric cannot exist there.
The fix is the textfile collector: a small script that reads what the guest can see
(/proc/cpuinfo) and writes Prometheus-format metrics into a directory node_exporter
scrapes:
# /opt/node-exporter-textfile/cpu-mhz.sh — run from cron every 5 minutes
awk -F: '
  /^processor/ { c = $2; gsub(/[ \t]/, "", c) }
  /^cpu MHz/   { f = $2; gsub(/[ \t]/, "", f); printf "node_cpu_mhz_current_hz{core=\"%s\"} %.0f\n", c, f * 1000000 }
' /proc/cpuinfo
with
command:
  - '--collector.textfile.directory=/textfile'
volumes:
  - /opt/node-exporter-textfile:/textfile:ro
Two deliberate decisions: the metric is published under a different name than
node_exporter’s own (node_cpu_mhz_current_hz, not node_cpu_scaling_frequency_hertz)
so that if the host ever exposes real cpufreq there is no duplicate-series conflict, and
the dashboards merge the two sources explicitly:
sum(node_cpu_scaling_frequency_hertz or node_cpu_mhz_current_hz)Wrong #4: my exporter was reporting the container’s name as the host’s
The host dropdown in the dashboard offered 9f9afcccc962 as a machine. That’s a container
ID: node_exporter’s uname collector reports the process’s UTS namespace, and a
container’s hostname defaults to its own ID. The metric was correct, the label was
meaningless. One line in compose fixes it:
services:
  node_exporter:
    hostname: 2.hoelee.com   # otherwise `nodename` = the container ID
What I’d do differently
- Build the aggregate/overview screen last, deliberately. Deciding “what is total storage?” is what forces the deduplication work — discovering it after building three host dashboards means rebuilding the number everywhere.
- Pin container
hostnamefrom the start. It costs one line and saves a confusing dropdown. - Assume every virtualised or appliance host hides one class of metric. A NAS may cap your container monitor (DSM’s Docker API version pinned my cAdvisor to v0.53.0 — newer releases need a newer Docker API); a VM hides cpufreq; a router hides its own CPU. Find the gap by counting what you expected rather than trusting that the collector succeeded.
The result
Three hosts, 7 scrape targets, one Grafana, 16 alert rules, and a single screen that reads: 47 CPU cores · 158 GHz currently clocked (205 GHz nominal) · 142 GB RAM · 64 TB storage · 155 running containers, with the same host and container dashboard layout cloned per machine so the three read identically. Alerts land in Telegram and email; Prometheus keeps 30 days.
The most useful outcome wasn’t the dashboard. It was the alert that fired the day the storage rule was rewritten: a NAS volume with 21 GB left, which had been hidden behind a percentage threshold on a volume so large that “99% full” had become background noise.
Want this for your business?
If you run a NAS, a VPS and a couple of servers and have no single place to see them, I set up self-hosted monitoring pipelines like this one — Prometheus + Grafana across your machines, host and container metrics, disk-health and capacity rules that mean something, and alerts pushed to Telegram or email.
WhatsApp: +60 12-797 2969 · Email: [email protected] · hoelee.com
Website design and development is my main line of work; server hardening and self-hosted infrastructure is the other half of it.