Why Your Grafana Dashboard Shows No Data (When Prometheus Is Fine)
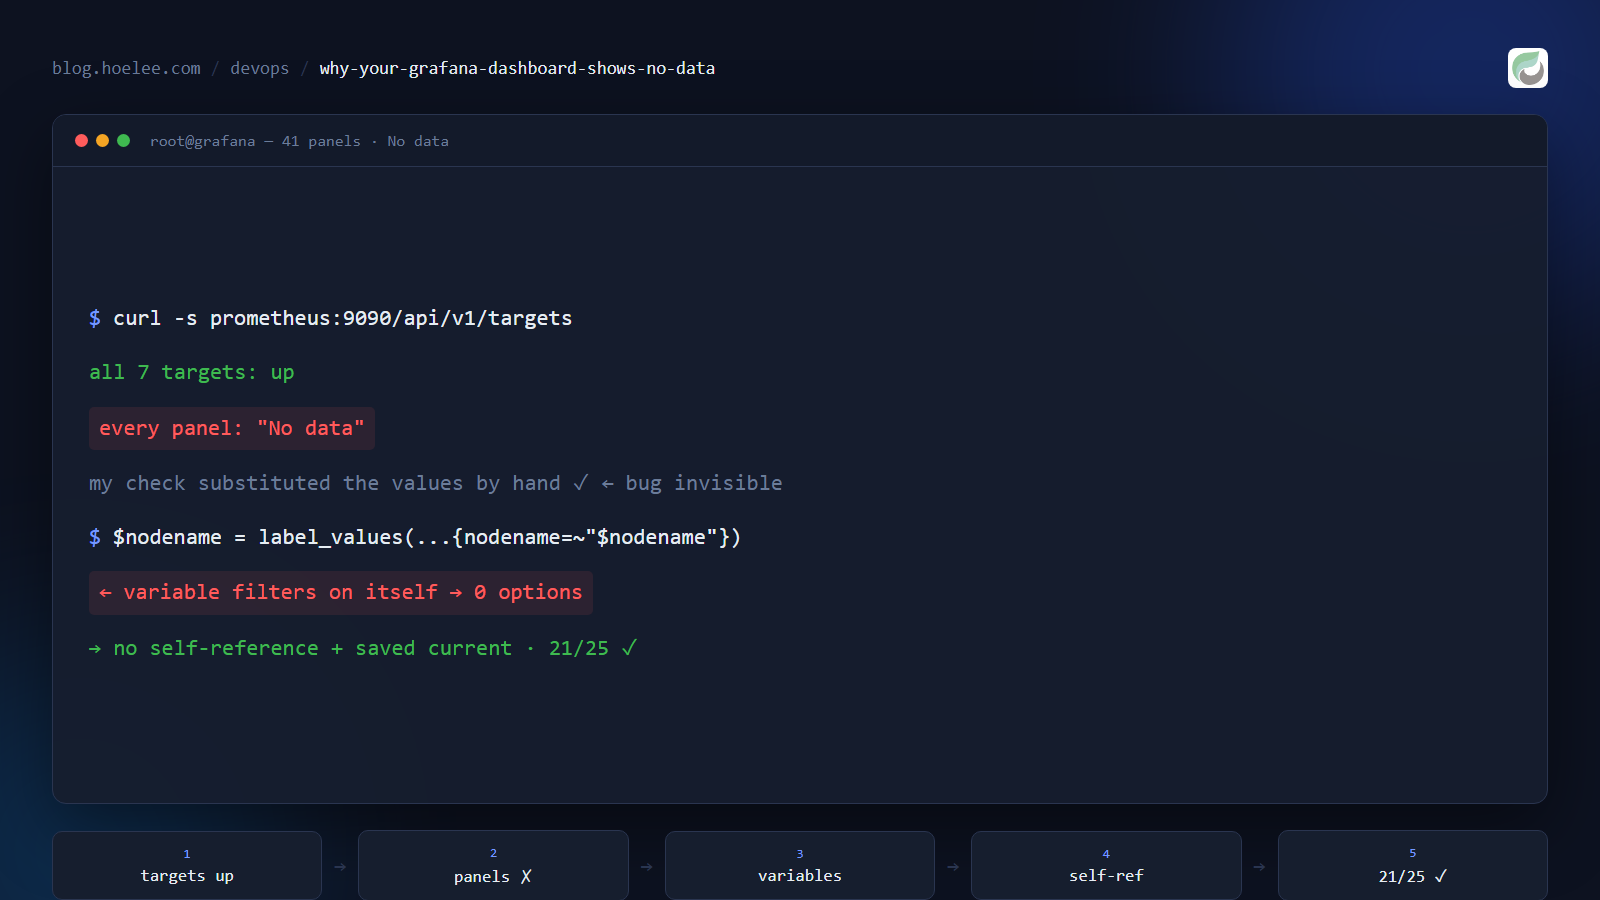
You open the dashboard you use every day and it’s empty. Not “one panel broke” empty — every panel, top to bottom, says No data. You check Prometheus and everything is healthy. This post is the specific, non-obvious cause I hit, and the way my own verification convinced me the dashboard was fine while it wasn’t.
The searchable question
My Grafana panels show No data but the data is in Prometheus — why?
The usual answers (wrong datasource, wrong time range, rate() on a counter that
resets, missing scrape target) did not apply. Here is the checklist that narrowed it
down, in the order that costs the least time:
# 1. is the target actually being scraped?
curl -s http://prometheus:9090/api/v1/targets | jq '.data.activeTargets[] | {job:.labels.job, health}'

# 2. does the metric exist right now?  (bypasses Grafana entirely)
curl -s -G http://prometheus:9090/api/v1/query \
  --data-urlencode 'query=node_uname_info{job="unraid-host"}' | jq '.data.result[0].metric'

# 3. is the panel's expression sound?
curl -s -G http://prometheus:9090/api/v1/query \
  --data-urlencode 'query=count(node_cpu_seconds_total{mode="idle",job="unraid-host"})'
All three were green: 7 targets up, 25k series ingested, and the panel’s raw
expression returned data when I ran it by hand. So the problem was not the metrics,
the scrape, or the PromQL — it was the variable layer between them.
The actual cause: a variable that filtered on itself
The dashboard had a host picker. Two variables chained: $nodename (which machine)
and $node (its instance label). The definition of the first one was:
# BROKEN — the variable filters on its own value
label_values(node_uname_info{job="unraid-host", nodename=~"$nodename"}, nodename)
On first load $nodename has no value, so the selector becomes
nodename=~"" — which matches nothing. A variable whose query returns no rows has
no options, so it stays empty. $node is then defined against $nodename:
label_values(node_uname_info{job="unraid-host", nodename="$nodename"}, instance)…which is also empty, so every panel filtering on $node matches no series. Grafana
isn’t lying when it says No data: the panel query genuinely has no data, because the
variable that scopes it resolved to nothing.
The fix is to stop the self-reference and give each variable an explicit saved default:
# FIXED — no self-reference, one hop per variable
# $nodename
label_values(node_uname_info{job="unraid-host"}, nodename)
# $node
label_values(node_uname_info{job="unraid-host", nodename="$nodename"}, instance)
Then save current values for both so the dashboard opens populated instead of
depending on a click. (This is also why the same 41-panel layout can be cloned to
three hosts and just work.)
Why my verification missed it
This is the part worth stealing. I “verified” the dashboard by expanding each panel’s
expression by hand, substituting the variable values I knew were correct
($nodename=unRaid, $node=host.docker.internal:9100), and asserting the query
returned points. Thirteen of those checks passed. The dashboard was still blank,
because the bug was upstream of the substitution: Grafana’s own resolution of the
variables was empty.
A verification that substitutes the very value under suspicion cannot detect that value failing to resolve. To catch it, read the values Grafana actually saved and expand with those:
curl -s -u admin:"$PW" http://grafana:4010/api/dashboards/uid/rYdddlPWk \
  | jq '.dashboard.templating.list[] | {name, current: .current.value}'
The correct check is on the variable query itself — run what Grafana runs:
# what does $nodename's label_values() actually return?
curl -s -G http://prometheus:9090/api/v1/query \
  --data-urlencode 'query=count by (nodename) (node_uname_info{job="unraid-host"})' | jq '.data.result'
Empty there means the dashboard cannot possibly render, no matter how healthy the data is.
The second trap: $__all is not .*
While automating panel checks, a variable set to All reports its current value as the
sentinel string $__all — not a regex. Expanding panel expressions naively turns
name=~"$__all" into a literal that matches nothing, so a perfectly healthy
container dashboard “fails” every panel. Resolve $__all to the variable’s allValue
(usually .*) before expanding, or you’ll chase a bug that only exists in your checker.
Not every empty panel is a bug
After the fix, 21 of 25 panels had data. The remaining four were empty by design and worth naming honestly in the panel description:
- PSI panels (
Pressure,Pressure Stall Information) need/proc/pressure, which the NAS kernel doesn’t expose. The metric cannot exist there — the same panels on a host that does exportnode_pressure_*render fine. - Root filesystem panels whose expression carries
fstype!="rootfs"can never match on a host whose/is a ramdisk, which is what unRaid’s root is.
Distinguishing “broken because of a bug” from “empty because the metric cannot exist on this host” is the difference between a real fix and a wild goose chase.
What I’d do differently
- Never define a template variable that filters on itself. One hop per variable.
- Always save explicit
currentvalues for variables a dashboard depends on, so a fresh load doesn’t rely on a populated dropdown. - Verify with Grafana’s saved values, not my idea of them. The masking is invisible in the test result and obvious in the UI.
- Describe intentional gaps in the panel description. Future-you will otherwise spend an afternoon “fixing” a panel that was never meant to work there.
The result
All three hosts now run the same instrumented layout — a 41-panel host dashboard and a 10-panel container dashboard each — with 21/23/25 panels returning data respectively, and the two structurally-empty classes documented in place instead of silently confusing whoever opens them next.
Want this for your business?
If you have Grafana dashboards that nobody trusts — or servers and a NAS with no monitoring at all — I build self-hosted Prometheus + Grafana stacks (host and container metrics, sensible alert rules, alerts to Telegram and email) and I’ll fix the ones that have quietly stopped showing data.
WhatsApp: +60 12-797 2969 · Email: [email protected] · hoelee.com
Website design and development is my main line of work; server hardening and self-hosted infrastructure is the other half of it.