I Parsed 46,777 Requests to My Static Site and Found 70× More Deploy Checks Than Human Hits

Why It Matters
The tools site I run for small businesses — 36 browser-only utilities for
taxes, quotations, e-invoices, QR codes and images — makes a public promise
that is easy to write and expensive to keep: nothing is uploaded. No
backend, no API calls, no analytics, no cookies, no third-party host. A
build gate called audit-dist walks the finished output and fails the build
if any external host appears anywhere in it.
That promise has a bill attached, and the bill is that the site cannot answer the simplest question a business asks about a website: did anyone come? There is no tracker to read, no session table, no dashboard. What exists is the nginx access log inside the site’s single container and the knowledge that anything I compute from it has to be computed carefully, because there is exactly one attempt available and no independent source to cross-check it against.
This is the record of that measurement, in the order it went wrong: the promise, the log, the two numbers I got and had to throw away, the 202 requests that were left when the noise was removed, and the funnel I built anyway for the visitors who had not arrived yet.
Every number in it starts from one subtraction. The log held 46,777 requests over the 6.6 days I measured, 26,224 of them assets — JavaScript chunks, CSS, images, fonts — which leaves 20,553 requests that were not assets. Everything after this paragraph is about that 20,553.
The Promise That Forbids Measuring
There is a real product reason for the no-upload design, and it is not
purity. A Malaysian SME that needs to turn a quotation into a PDF or check
whether an NRIC number is structurally valid does not want to send the
document, the staff list or the payroll figures to a stranger’s server, and
cannot always say why in a compliance document. A page that does the work in
the visitor’s own browser has no data-processing question to answer. The
186 URLs in the sitemap — 36 tools across English, /ms/ Malay and
/zh/ Chinese — all run on that basis.
The cost lands on me: every number in this post is derived from one log file. There is no JavaScript tag to confirm it, no segment to compare it against, and no way to recompute a different definition next month and call the difference insight.
Where the Numbers Had to Come From
The site runs as a single container, tools-web, on nginx:1.29-alpine, on
my Synology NAS. SSH to that box rejects keys, so the route in is the
Portainer API: find the container, then ask Docker for its own log store,
because nginx writes the access log to stdout and Docker is what keeps it.
One read-only GET returns forty-eight thousand lines, and it needs nothing
installed on the host.
The window I measured ran from 2026-11-06 09:41Z to 2026-11-12 23:51Z — 6.6 days, and everything below is about the 20,553 non-asset requests it produced. Every figure is a request count. Not visitors, not sessions. A request count is the only unit this log can produce honestly, because the site sets no cookie and therefore cannot stitch two requests into one person.
The First Wrong Number: 11,930 Humans
The first classifier was the obvious one: drop the assets, then drop any request whose user agent looked like a crawler, and call the remainder human. It reported 11,930 humans.
All 11,930 were mine. After every deploy, a script called live_check.py
walks all 186 sitemap routes plus a set of headless-Chrome probes, and it
sends a user agent of hoelee-tools-live-check. My filter had a list of
crawler names in it — Googlebot, bingbot, and so on — and my own tool was
not on the list, so the largest single source of traffic on the site was
politely classified as an audience. The tell was in the numbers, not the
code: 11,930 is suspiciously close to 186 routes times the number of deploys
and retries in a week, and no small site gets eleven thousand visitors with
three external referrers.
The Second Wrong Number: 3,750
The second version fixed that by adding my own tool to the bot list, and
reported 3,750 humans. This one was wrong in a more interesting way: it
was full of scanners running on Google Cloud addresses with ordinary Chrome
user agents. The largest of them sent 1,172 requests, of which 1,140 were
404s for variants of /.env — the request pattern of someone looking for
a leaked credential file, dressed as a browser.
That is the whole problem with the user-agent string in one example: the string is supplied by the client, so a script that wants to look like a visitor types the same thing a visitor’s browser types. Two of the categories I was trying to separate were written by the same hand.
The Bug That Left Six Humans
The version just before the last one is the one worth admitting. I added
Mozilla/5.0 as a bot prefix, because so many crawlers begin their user
agent with it. Every real browser begins with it too. The human count
collapsed to 6, and 6 is the number that finally made me stop editing
the list and look at what the list was doing.
A user-agent filter cannot be repaired by adding names, because the two errors pull in opposite directions: every name added to catch a liar also catches the honest clients that share the prefix, and every name removed to protect real browsers lets a scanner back in. I had written a classifier whose accuracy depended on a field the adversary controls.
What the Log Actually Held
The version that shipped classifies in more than one pass and puts every ambiguous client in a named bucket instead of deleting it. Over the 20,553 non-asset requests:
| Bucket | Requests | Share |
|---|---|---|
My own deploy-time checks (live_check.py + headless probes) | 14,228 | 69.2% |
| Cloud scanners sending browser user agents | 2,298 | 11.2% |
| Declared crawlers and link-preview fetchers | 1,883 | 9.2% |
| My own home WAN address | 1,250 | 6.1% |
Credential hunters (/.env, /.git/config, /xmlrpc.php, wp-login) | 692 | 3.4% |
| Everything left, across 101 addresses | 202 | 1.0% |
The headline ratio comes from the first and last rows: 14,228 requests from my own deploy check against 202 from everyone else — 70 times more deploy check than human hit. Both sides of that sentence are request counts, not people, and the ratio says less about the internet than about my own tooling: the biggest consumer of my site’s bandwidth is a script I wrote to confirm the site works.
That 70 is also worth pinning against the largest honest number in the log, because a reader is entitled to call the numerator self-inflicted and the comparison cherry-picked. Add every machine bucket — 14,228 + 2,298 + 1,883 + 692 = 19,101 — and the log holds 19,101 machine requests against those 202, which is 94.5×. Both ratios are in this post on purpose: 94.5× is the distance between all machine traffic and anything that might be a person, and 70× is the narrower claim that my own deploy check alone outnumbers the human residue. The 70 is the smaller of the two, not the flattering one.
Behaviour Found the Scanners
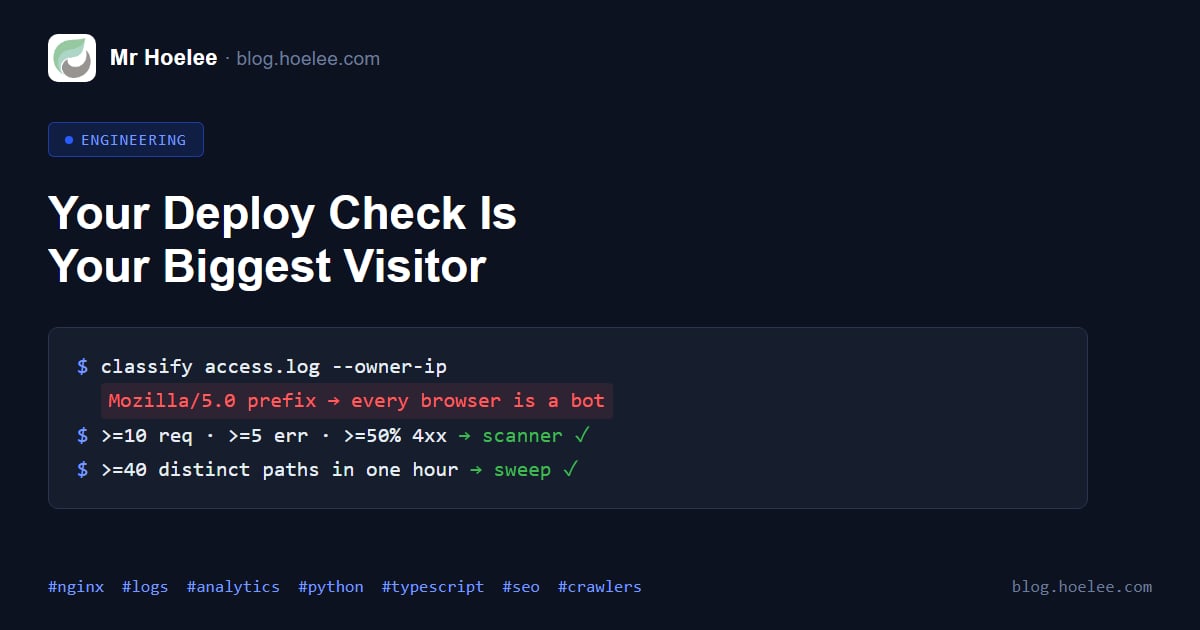
What actually worked was throwing away the identity question and asking about shape. A client is flagged when it has at least 10 requests and either at least 5 errors with at least half of its requests returning 4xx, or at least 40 distinct paths inside one hour. The second test is what catches an enumeration sweep; the first catches a client that keeps asking for things that are not there.
const MIN_REQUESTS = 10;
const MIN_ERRORS = 5;
const ERROR_SHARE = 0.5;
const DISTINCT_PATHS_PER_HOUR = 40;

// One row per address per hour. The week total never enters the decision.
function isScanner(bucket: { requests: number; errors: number; paths: Set<string> }) {
  if (bucket.requests < MIN_REQUESTS) return false;
  const errorBurst =
    bucket.errors >= MIN_ERRORS && bucket.errors / bucket.requests >= ERROR_SHARE;
  const pathSweep = bucket.paths.size >= DISTINCT_PATHS_PER_HOUR;
  return errorBurst || pathSweep;
}
A renderer that fetches 60 real pages in an hour touches 60 distinct paths and would trip the sweep test if 60 were the threshold — which is why the threshold is 40 per hour and why the crawler count is a separate bucket that is reported, never subtracted. The full two-pass classifier, the thresholds and the parser live in the tools repository rather than in this post, because the method is reusable and this post is about what it found.
The Owner Is a Bucket, Not a Subtraction
My own address arrives as an explicit --owner-ip argument and is counted
into its own row (1,250 requests) that appears in the output. It is never
silently removed. This sounds like bookkeeping and is actually the
difference between a measurement and a story: a classifier that quietly
deletes the operator’s traffic can produce any remaining total it likes, and
the reader has no way to check the arithmetic. Six buckets that add to the
raw non-asset count can be checked by hand. If they do not add up, the
classifier is broken and I can see it.
No IP address is written to any committed file. The output is aggregate counts only. The reason is not delicacy: the log is the one place where a visitor is identifiable at all, and a funnel that asks a visitor to open WhatsApp does not need to know who they were before they did.
What the Count Still Gets Wrong
Six buckets that add up are checkable, not correct. Three defects survive inside the 202, and all three are generous in the same direction.
Fourteen asset requests are counted as pages. A request for a path under
/assets/ whose last segment carries no recognised extension — a hash-named
chunk served without one, a font requested with a query string appended —
falls through to the human bucket, because the extension test is what
separates pages from assets and there is nothing to test. These are not
people; they are the same page load already counted once.
Thirteen scan paths slip past the credential regex. //phpmyadmin,
/PHPMyAdmin/index.php and percent-encoded %2eenv variants are the same
hunt as /.env, spelled to defeat a case-sensitive match, and they are
counted as human page requests.
The owner bucket is one static address. It is correct for this window because the address did not change inside it, but the argument rests on a value rather than on a rule: a fibre line behind carrier-grade NAT gets a new address eventually, and on the day it does, 1,250 requests leave the owner row and walk into whichever bucket the new address lands in. Nothing in the classifier would warn me.
Two of the three can be counted from the log itself, which is the only reason
they belong in the post. Fourteen of the 202 ask for a path under /assets/ —
one gallery image requested thirteen times, plus one malformed srcset string
that arrived as a single path — and fifteen came back as something other than
200: fourteen 404s and one 301, several of them credential hunts too small to
trip the scanner threshold (/dev/.env, /media../.env, /appsettings.json,
/gcp-credentials.json, /service-account.json, //wordpress/, /wp-json/).
So the requests that were a page and answered 200 number 187, not 202, and the ratios recompute instead of collapsing: 14,228 / 187 = 76× and 19,101 / 187 = 102×. That arithmetic is the reason to publish the three defects instead of rounding them away: a ratio that can absorb its own error bars is a measurement, and a ratio that cannot is a claim.
Three Referrers, All Google, None From Search
For the whole 6.6 days the log recorded three external referrers, all from google.com. Zero visitors arrived from a search result page. The tools site is indexed, its pages are useful, and by the only evidence available nobody found it by searching.
That is the finding that reorganised the work. Every hour spent on conversion was an hour spent on a step that had almost no input. Whatever the site’s problem is, it is upstream of the tool pages.
The Crawler Learned to Render
The most useful signal in the log was the one that grew. Google’s rendering
crawler fetched tool pages on the days I have counts for: 11 page fetches
on 2026-11-08, 44 on 11-10, 16 on 11-11 and 60 on 11-12. Its last fetches
on 11-12, between 22:12Z and 22:39Z, were /qr-code-generator/,
/whatsapp-link-builder/ and /ms/pemotong-gambar/, followed by the
JavaScript chunks those pages load (store-zip, exif). A crawler that
fetches the chunk a page needs in order to run is rendering the page, not
reading robots.txt.
I want to be exact about what that does and does not mean. Crawling is not indexing. A fetch proves the page was retrieved and executed; it does not prove it was indexed, and it certainly does not prove it was ranked. The referrer count for the same week — three, all google.com, none from a results page — is the proof that being fetched had not yet turned into being found.
The 404 That Was Actually Mine
Almost every 404 on a plausible-looking path was a credential hunter probing
a WordPress or Laravel layout the site has never had: /.env,
/.git/config, /xmlrpc.php, wp-login. Those are noise and the
classifier now labels them.
One 404 was real. Inbound traffic was arriving at /myKad-parser with a
capital K. The route is lower-case — /mykad-parser/ — so the capital K
404s, and that is the only genuinely broken inbound link in the week. The
log tells me the request happened and nothing about where the link lives, so
I know the link exists and cannot yet see it.
The Sitemap Name Nobody Had Checked
The sitemap at /sitemap.xml is hand-rolled: 186 URLs, four xhtml:link
alternates per URL for the English, Malay and Chinese versions. It is
hand-rolled because @astrojs/sitemap drops the Malay locale when the slugs
differ per locale, which they do.
Hand-rolling the sitemap fixed the content and left the name. The log shows
crawlers asking for /sitemap-index.xml and /sitemap_index.xml —
the names Astro’s own integration and most crawlers guess first — getting a
404, and then not continuing. The list of clients that stopped at that 404
includes DeepSeekBot, KimiBot, MoonshotBot, cohere-ai, Hunyuan,
PerplexityBot, ExaSearchBot, IsonSearchBot, MJ12bot, ccrawl and
AgentRegistryCrawler. A crawler that cannot find the sitemap does not
necessarily crawl nothing, but it stops being systematic, and for a site
with no inbound links that is most of the discovery budget.
The fix that shipped is small and deliberately boring: /sitemap-index.xml
is now a one-entry sitemap index pointing at /sitemap.xml. The sitemap
specification allows a sitemapindex to reference a sitemap, so this is
valid rather than a trick. It carries no <lastmod>, because the dates
inside the sitemap are synthetic and stable — a maximum of them would
restate a fiction in a second place, and a crawler that trusts it would be
trusting two copies of the same guess.
A build gate now fails if the alias is missing, if it is not a
sitemapindex, or if it references anything other than the one sitemap.
That last clause is the important one: duplicating the page list into the
alias would create a second source of truth that nothing checks, and the
first time the two drifted the site would advertise a sitemap that disagrees
with itself.
The Funnel Built for Visitors Who Are Not There Yet
The referrer count says the bottleneck is distribution. The 70:1 ratio says my own traffic dominates the log. Neither of those is a reason to ship nothing, so the same day I built the part of the funnel that does not depend on volume — the part that decides what happens after someone finishes using a tool.
26 of the 36 tool pages now end with one quiet block below the download. Three sentences: the manual ceiling of the artefact the visitor just made, the permanent operational state that a growing business outgrows it for, and an open question about the current setup. Below that, a ghost link that opens WhatsApp with a message already written.
The message is static, and that is a design decision with a technical cause.
wa.me/?text= is a navigation: the moment the link is clicked the text is
in a URL on WhatsApp’s servers, whether or not anything is sent. My first
draft interpolated the visitor’s own total from the quotation tool into that
link so the message would open with “my quote came to RM X”. That draft was
rejected, by me, for exactly this reason: the number would have left the
browser before anybody pressed send, which is the one thing the whole site
promises not to do.
The only variable part of the message is the page slug, and it is the
attribution: the first line I read in the chat is
— from tools.hoelee.com/quotation-pdf. That is how a site with no
analytics still reports which page produced a conversation. It is worse data
than a funnel report and it is honest data, collected with the visitor’s
knowledge, at the moment they chose to make contact.
10 tools carry no commercial block at all. For a visitor whose real next step is a regulated filing — KWSP, PERKESO, LHDN, JTKSM, SSM — the honest close is not a sales pitch. The ten are payroll, stamp duty, overtime, the SSM validator, SST, NRIC, the MyKad parser and the three e-Invoice tools. Each one has the reason written beside its slug in the source, so the next person to touch the file does not have to reconstruct the judgement.
Also removed the same day: a generic lead banner that sat on every tool page. On the 26 pages it carried the block for a second time and put a primary button next to the download, competing with the one action the page exists for. On the 10 statutory pages it sold website design directly underneath a tax refusal, which is the worst-placed advertisement I have shipped.
The Result
- 46,777 requests over 6.6 days, of which 20,553 were not assets and 202 were plausibly people — across 101 addresses.
- 14,228 requests were my own deploy check: 70 times the entire human slice, and 69.2% of all non-asset traffic.
- 19,101 machine requests in total — 14,228 + 2,298 + 1,883 + 692 — which is 94.5× the 202. That is the figure to quote if the deploy check is dismissed as self-inflicted.
- Three external referrers, all google.com, zero from search — the measured reason the bottleneck is distribution.
- 131 page fetches from Google’s rendering crawler on the four days I have counts for (11, 44, 16, 60), ending on real tool pages and their JavaScript chunks. Crawling, not indexing.
- 26 of 36 tool pages carry the static-message WhatsApp block with slug-only attribution; 10 carry nothing, each with a written reason.
- One sitemap alias shipped and gated; one broken inbound link
(
/myKad-parser) found and still open.
The one number I cannot give is the conversion rate of that block, because measuring it would require the tracker the site exists to not have. The first honest read will be the chats themselves, and the slug on the first line of each.
What I Would Do Differently
Classify by behaviour first, and use the user agent only to label a bucket
that behaviour has already separated. Both of my wrong numbers came from
trusting that string, and the second one was wrong in the direction that
flatters — three thousand “humans” that were one scanner with a list of
.env paths.
Second: exclude my own traffic as a bucket with a name, and print the buckets so they add up. The moment the numbers stopped balancing I found the bug in the classifier instead of the bug in the story.
Third: check the URLs crawlers guess before wondering why nothing is
indexed. /sitemap-index.xml cost one line of nginx or one file in
public/ and eleven kinds of crawler were asking for it. That is the
cheapest discovery fix available and it sat unshipped for as long as the
site had a hand-rolled sitemap.
And the last one is a judgement about effort. The funnel work was worth doing and I would do it again, but it was not the constraint. A site with 202 possible visitors and three referrers does not have a conversion problem, and the next month of work on this site belongs upstream of the tool pages.
Want a 24/7 bot or automation pipeline that never drops a lead?
Don't let customer inquiries slip away at midnight or on weekends. I build custom Telegram/WhatsApp AI assistants and deterministic workflows that connect directly to your catalogue, CRM, and order fulfillment.