Your Deploy Check Is Your Biggest Visitor

The Number the Log Could Not Answer
The utility suite I maintain has no analytics. No tracker, no cookie, no backend — the deployment gate fails the build if a third-party host appears in the output, which is a deliberate posture rather than an oversight: thirty-odd small tools for tax, e-invoices, PDFs and phone-number cleaning, used by people who have no reason to be profiled for it.
That posture leaves one question genuinely hard to answer: is anyone using this? Not for vanity — the next decision on the site depends on it. There are 36 tools across 186 routes in three languages, and every hour spent improving one of them is an hour not spent on the others. Without a number, the choice of which tool deserves that hour is a hunch.
The answer was already on disk. One nginx container serves the whole site, and nginx has been writing a combined access log to stdout since the container was created. No instrumentation, no consent banner, nothing that had to move in the browser:
| What the log contained | Count |
|---|---|
| Log lines in the 6.6-day window | 48,018 |
| Parsed requests | 46,777 |
| Requests that were not assets or crawler files | 20,553 |
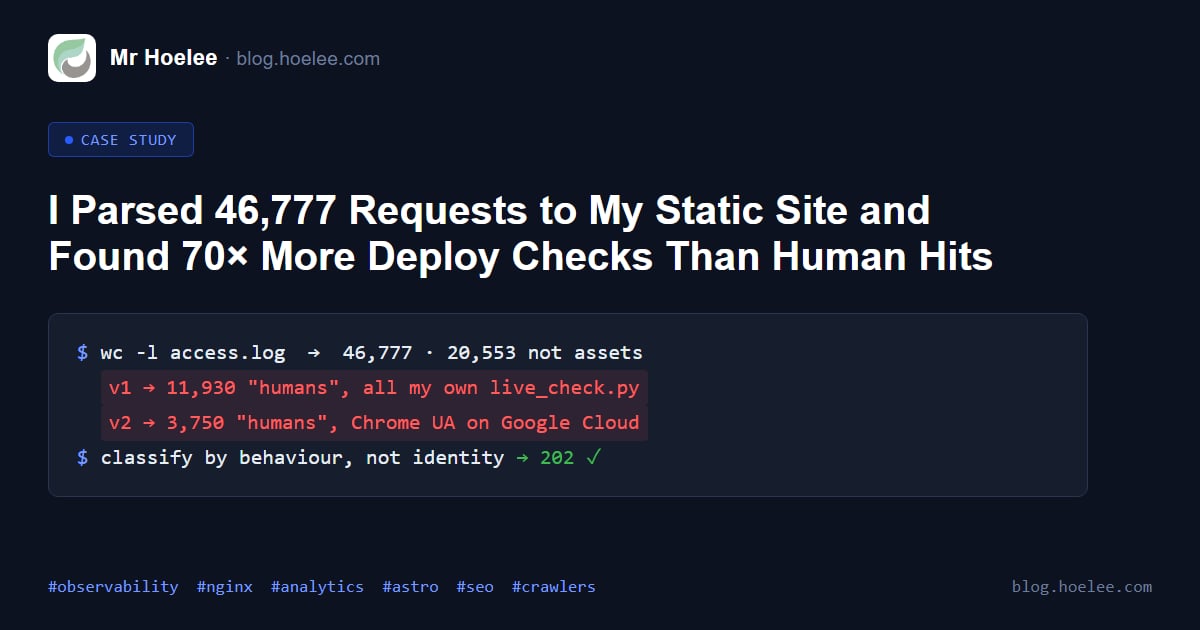
The numbers came out in an order I did not expect: 14,228 requests from my own deploy-time check, 2,298 from cloud scanners, 1,883 from declared crawlers, 692 from credential hunters, 202 from everyone who might have been a person. My own health check outnumbered the humans by 70 to 1.
Getting to them took three attempts, and the first two were wrong in ways worth writing down — the same ways any small site gets its own traffic wrong. The method below is what finally produced those figures, and it is written to be lifted: one pass to remove the things that cannot be people, one pass to classify by behaviour, and a rule that every request ends up in a named bucket that adds up to the raw count.
Three Wrong Answers Before the Right One
Attempt one: filter the user agent. Everything that is not on a crawler
list counts as human. The result was 11,930 humans in 6.6 days —
flattering, plausible for a site that had just been submitted to Search
Console, and completely wrong. The biggest single contributor was my own
deploy-time live check: a script called live_check.py, user agent
hoelee-tools-live-check, that walks all 186 sitemap routes after every
deployment, plus the headless-Chrome probes around it. Its name was not on a
list of crawlers, so the largest single source of traffic on the site was
politely classified as an audience. Once marked, those requests accounted
for 14,228 — 30.4% of everything, and 70 times the human traffic.
Attempt two: exclude the tooling. Now the count was 3,750 humans,
which is also plausible and also wrong. It was scanners on cloud addresses
sending a Chrome user agent. Three of those addresses sent 1,172 requests of
which 1,140 — 97% — were 404s for paths this site has never had:
/.env, service-account.json, gcp-credentials.json. A user-agent filter
cannot see them, because the agent string is a claim and they were claiming
to be browsers.
Attempt three: add the giveaway agents to the bot list. One entry was a
bare Mozilla/5.0 prefix, on the reasonable-sounding theory that an agent
beginning with it and saying nothing else is a script. Every real browser
begins with it. That entry silently marked the audience as bots and
collapsed a week of traffic to six humans — a bug that produced a small,
tidy, entirely fictional number, and one that would have looked like a
finding in a report.
The lesson from the third one is the useful one: a classifier that is wrong in the flattering direction gets noticed, and a classifier that is wrong in the deflating direction gets published. Neither is measurement.
Three failures, one field. The conclusion I drew is not “write a better list”. It is that identity is the wrong question and shape is the right one.
The Two-Pass Shape
Pass one is arithmetic, not judgement. Drop asset requests by the paths a
build emits (/_astro/, images, fonts, source maps), and parse the status
and path out of the combined log line. That leaves the requests that could
plausibly be someone asking for a page.
Pass two never looks at the user-agent string to decide anything. It aggregates per address per hour and asks three questions in order: does this address have a burst of errors, does it sweep a large number of distinct paths, does it match an address I set aside deliberately. The user-agent string is used only afterwards, to give a name to a bucket that behaviour has already separated — “declared crawler” versus “scanner in a browser costume” is a labelling step, not a filter.
The output is a fixed set of buckets that must sum to the non-asset total. If they do not, the classifier has a bug and the run fails instead of printing a plausible number.
The Asset Cut Is Cheaper Than It Looks
In my log, 26,224 of 46,777 requests were assets — 56%. A large fraction of those are one page load: a modern static page pulls its own HTML plus hashed chunks, a font or two and a couple of images. Counting them as traffic inflates every ratio downstream, and if the site ships a service worker the same asset arrives once per deploy per client.
The cheap cut is by path prefix, and it is worth being exact about that
because the obvious version is by extension. A suffix test keeps
/sitemap.xml and /robots.txt in the page-view bucket, where they are
neither assets nor visitors, and it drops a .json response that carries
data. Cutting on /_astro/, the brand mark, the favicon, the robot and
sitemap files, the health endpoint and the og- images removes the bulk and
leaves a residual that can be explained path by path. What matters is that
the cut is stated: every number in the final table is a count of requests
that survived a named rule, and anyone re-running it can reproduce the cut.
Behaviour Is the Rule That Found Them
A client is flagged when it has at least 10 requests and either at least 5 errors with at least half of its requests returning 4xx, or at least 40 distinct paths inside one hour.
const MIN_REQUESTS = 10;
const MIN_ERRORS = 5;
const ERROR_SHARE = 0.5;
const DISTINCT_PATHS_PER_HOUR = 40;

type Bucket = {
  ip: string;
  hour: string;        // "2026-11-06T09" — one row per address per hour
  requests: number;
  errors: number;      // 4xx and 5xx
  paths: Set<string>;  // pathname only, query string stripped
};

function isScanner(b: Bucket): boolean {
  if (b.requests < MIN_REQUESTS) return false;
  const errorShare = b.errors / b.requests;
  const errorBurst = b.errors >= MIN_ERRORS && errorShare >= ERROR_SHARE;
  const pathSweep = b.paths.size >= DISTINCT_PATHS_PER_HOUR;
  return errorBurst || pathSweep;
}
Four things about that rule are deliberate.
- It is per address per hour, not per address per week. The week total never enters the decision. A crawler that fetches 60 real pages spread over four days is not a sweep; a client that asks for 40 different paths inside one hour is enumerating.
- Both tests are needed. The
.envscanner fails the error test (1,140 of its 1,172 requests were 404s) and would also fail the sweep test. A quieter scanner that walks plausible URLs and gets 200s fails only the sweep test. MIN_REQUESTSprotects the long tail. Without a floor, a single 404 from a real visitor’s mistyped URL becomes a 100% error rate. Ten requests is still small enough to catch a slow prober.- The 40-path threshold sits above the busiest day I measured for an honest renderer — 60 page fetches in a day for Google’s crawler — so a normal crawl day cannot sweep past it. That is a margin, not a proof: a renderer that bunched 40 fetches into a single hour would be labelled a scanner, which is exactly why a behavioural verdict names a bucket instead of deleting the requests.
Both rules ask what a client asked for, never who it claims to be. That is the whole difference between this pass and the three that failed before it.
The Owner Is a Bucket, Not a Subtraction
My own address arrives as an explicit --owner-ip argument and lands in its
own row of the output — 1,250 requests in this window — which is printed
with the rest. It is never silently dropped.
The argument for doing it the boring way is inspectability. A classifier that quietly deletes the operator’s traffic can produce any total it likes from the remainder, and a reader has no way to check the arithmetic without re-running the tool. A table of buckets that sums to the raw non-asset count can be checked by hand in a minute. This is also why the operator bucket is separate from the deploy-check bucket: the first is me reading the site, the second is a script confirming the site. Collapsing them would hide that the script is eleven times bigger than the person it works for.
A report that removes the awkward rows is not a report.
Parsing the Log Without a Log Stack
The log lives inside the site’s container (nginx:1.29-alpine). SSH to the
host rejects keys, so the route in is the Portainer API: one GET for the
container’s log store, because nginx writes its access log to stdout and
Docker is what keeps it. It is read-only, which is the property that
matters, and it returns the whole container’s life in one response.
The parser is a regex over the combined log format and one dict keyed by address and hour:
import re
from collections import defaultdict

# Combined log format, plus the X-Forwarded-For field my reverse proxy appends:
# the container-network address in $remote_addr is useless for classifying clients.
LINE = re.compile(
    r'(?P<ip>\d+\.\d+\.\d+\.\d+|-):?\S* \S+ \S+ \[(?P<ts>[^\]]+)\] '
    r'"(?P<method>[A-Z]+) (?P<path>\S+)[^"]*" (?P<status>\d{3}) \d+ '
    r'"[^"]*" "(?P<ua>[^"]*)"(?: "(?P<xff>[^"]*)")?'
)
# Assets are cut by path prefix, not by extension: the hashed bundles live under
# /_astro/ and the crawler files are named, so a suffix test would have kept
# /sitemap.xml and /robots.txt in the "page views" bucket.
ASSET = re.compile(r'^/(_astro/|brand-mark\.svg|favicon|robots\.txt|sitemap|healthz|apple-touch|og-)')

buckets = defaultdict(lambda: {"requests": 0, "errors": 0, "paths": set()})

with open("access.log", encoding="utf-8", errors="replace") as fh:
    for line in fh:
        m = LINE.match(line)
        if not m:
            continue
        path = m["path"].split("?")[0]
        if ASSET.search(path) or path.startswith("/_astro/"):
            continue
        # "06/Nov/2026:09:41:02 +0000" -> "2026-11-06T09"
        hour = m["ts"].split(":")[0][7:11] + "-" + m["ts"].split("/")[1] + "T" + m["ts"].split(":")[1]
        b = buckets[(m["ip"], hour)]
        b["requests"] += 1
        b["paths"].add(path)
        if 400 <= int(m["status"]) < 500:
            b["errors"] += 1
The hour key is the ugly part and it is where a re-implementation usually goes wrong: the timestamp is in the server’s local offset, so a bucket edge computed in UTC shifts every count by an hour and moves clients across the boundary. Pick one offset, state it, and never mix a local-time log with a UTC window in the same table.
What the Week Actually Contained
| Bucket | Page requests | What it is |
|---|---|---|
probe | 14,228 | my own verification: the live check walking 186 routes after each deploy, plus CDP probes |
automated | 2,298 | cloud addresses sending browser user agents; 97% of their requests were 404s |
bot | 1,883 | declared crawlers and link-preview fetchers |
owner | 1,250 | my own connection: testing, screenshots, the devices on the same network |
scan | 692 | /.env, /.git/config, /xmlrpc.php, wp-login |
human | 202 | everything left, across 101 addresses |
Two hundred and two page requests in 6.6 days is 30.7 a day, and the
honest reading of the day-by-day spread is that there is no audience yet:
28, 45, 20, 50, 31, 22, and 6 for the final partial day. Of the whole week’s
external referrers there were three, all https://www.google.com/.
Google fetched 188 pages from its own address ranges in a single week on a six-day-old site, which means the sitemap and robots files are being read — crawling, not readership. And the three busiest “human” clients were Google addresses plus a link-preview fetcher, so even 202 is generous.
The conclusion those numbers support is uncomfortable and useful: the first funnel layer is built, live, and being read by nobody. A funnel does not create demand; it only stops demand from leaking once demand exists. What I did with that finding — and what the numbers did to the next month of work — is in the case study that came out of this run.
What an Access Log Cannot Tell
The 202 requests across 101 addresses are not 202 visitors, and this is the section that keeps the post honest.
- A request is not a person. Three addresses in that residual are Google’s rendering crawler, which fetched 11, 44, 16 and 60 pages on the four days I have counts for. Those are in the human bucket only because they are neither sweeping nor erroring, not because they are people.
- No cookie means no session. The site sets nothing, so two requests from one address cannot be proven to be one visit, and one person on two devices is two addresses. Any “unique visitor” number derived from this log would be a definition dressed up as a measurement.
- NAT hides populations. A single address can be an office, a school or a mobile carrier’s gateway. There is no way to tell from the log.
- The instrument changes the thing it measures. My own deploy check is 69.2% of non-asset traffic. Any conclusion drawn from the raw totals without the operator bucket is a conclusion about my uptime script.
The honest sentence is “202 requests were not attributable to a known category, spread across 101 addresses, three of which are Google”. It is worse copy and it is the actual finding.
The Classifier’s Own Remaining Errors
Three known defects, stated here because a number with hidden gaps is worse than a smaller number with stated ones.
Assets are being counted as pages. The exclusion list covers /_astro/,
robots.txt, sitemap files and the brand mark, but not /assets/. So
portrait-280.webp appears in the human page list 14 times — a
responsive image request from a real browser, counted as a page view. Real
page requests are closer to 175 than 202.
Some credential hunting survives the path filter. The scan regex anchors
on a leading /., so /dev/.env, /%2Fsettings, //wp and /wordpress
slip through as human page views — 13 requests in the week. They change
nothing about the conclusion and everything about whether the number can be
quoted without a footnote.
The owner bucket is a static address. The home connection’s address was passed in explicitly, which is honest and fragile: on a connection whose address changes, the bucket silently stops classifying and those requests join the human count. It needs to be re-supplied per run, and the collector’s JSON records the aggregate only — no address is written to any committed file, which is the one privacy property worth keeping even in an internal report.
The method notes that make a rerun comparable are as important as the
classifier: the client address is the last quoted field (X-Forwarded-For
from the reverse proxy), not the container-network address; locale is folded
out of the path and reported beside the route; and the source is the Docker
log API, which means the baseline only exists as long as the container’s
log store does. The JSON snapshot is the artefact, not the log.
Crawlers Guess sitemap-index.xml First
Same log, different question: the log is also a record of what crawlers asked for and did not get.
The site’s sitemap is hand-rolled at /sitemap.xml — 186 URLs with four
xhtml:link alternates each — because the Astro integration drops the Malay
locale when slugs differ per locale. Hand-rolling fixed the content and left
the filename. Crawlers, and Astro’s own integration, guess
/sitemap-index.xml and /sitemap_index.xml first; both returned
404, and the clients that stopped there include DeepSeekBot, KimiBot,
MoonshotBot, cohere-ai, Hunyuan, PerplexityBot, ExaSearchBot, IsonSearchBot,
MJ12bot, ccrawl and AgentRegistryCrawler.
The fix is one file. A sitemapindex may reference a sitemap, so the alias
is spec-valid rather than a redirect trick:
<?xml version="1.0" encoding="UTF-8"?>
<sitemapindex xmlns="http://www.sitemaps.org/schemas/sitemap/0.9">
  <sitemap>
    <loc>https://tools.hoelee.com/sitemap.xml</loc>
  </sitemap>
</sitemapindex>
Two decisions inside those seven lines are worth copying.
No <lastmod>. The dates inside the real sitemap are synthetic and
stable rather than commit times. Restating their maximum in the alias would
put the same fiction in a second place, and a crawler that trusts the index
instead of the sitemap would be trusting a copy of a guess.
The alias is gated, and the gate is strict. The build fails if the alias
is missing, if it is not a sitemapindex, or if it references anything
other than the one sitemap. That last clause is the one that keeps it alive:
the tempting version lists pages directly in the index, which creates a
second source of truth that no test compares against the first. The first
time the two drifted, the site would serve a sitemap that disagrees with
itself and nothing would notice.
What I Would Do Differently
Behaviour first, and the user-agent string only as a label on an already-separated bucket. The first version I wrote took the string as evidence and produced 11,930 humans, all of them mine; the second produced 3,750, all of them one scanner family; the third produced 6, which is what a filter says when it has stopped meaning anything.
Print the buckets and assert they add up. The arithmetic is the only test that catches a classifier quietly deleting the operator, and it caught mine.
Make the number decomposable, because a metric that cannot be taken apart
cannot be argued with. 202 humans means nothing on its own; 202, of which 14 are assets and 13 are credential probes, from 101 addresses, against 14,228 of my own probes can be checked — and decomposing it is what
surfaced three of the defects above.
Read the 404s before writing the classifier’s ignore-list. Eleven crawlers had been asking for a sitemap name the site never served, and the log had been recording the 404s the whole time — I was reading the log for traffic and it was trying to tell me about discovery. A measurement run for one question answers a different one when the buckets are honest enough to look at.
Dealing with flaky containers, cloud cost bloat, or unexplained outages?
Real production reliability comes from understanding the kernel and the protocol layers, not just restarting containers. I manage 162 containers across 3 hosts running 24/7 client workloads.